Energy Workflow Transformation
Led the digital transformation of legacy Excel-based workflows for a major European energy corporation, delivering significant improvements in efficiency and accuracy.
Problem Statement
The client's reliance on Excel macros for grid modernization analysis led to complex maintenance, poor reusability, and fragmented data across multiple files, making project tracking inefficient. This approach limited scalability and hindered effective gap analysis.
🎯 Enabled client to secure a $100M contract in the U.S.
Transforming capabilities and opening new market opportunities
"The client loves the new solution. The transformation has exceeded expectations with dramatic improvements in speed, accuracy, and user experience."
💡 The new workflow has become a cornerstone of operational efficiency
The Solution
Custom workflow platform replacing legacy Excel systems
Requirements & Documentation
Data & Visualization
Process & Implementation
Applied process decomposition to identify and modernize key components of grid management workflows.
Standardized and mapped raw data into system-ready formats, enabling parity between client Excel models and platform outputs.
Validated system outputs by cross-checking against client project data to ensure analytical integrity and build client trust.
Technical Collaboration
Documented feature interdependencies across modules and included them in user stories, allowing developers to understand integration points and implementation sequencing.
Collaborated with frontend engineers to resolve layout and performance issues when large datasets caused chart or table breakages.
Key Impact & Leadership
Mapped dependencies across interconnected modules, helping the team avoid technical debt and reducing integration risks.
Led UAT and end-to-end testing without a QA, performed deep testing, validated corner cases, and ensured data consistency, which reduced post-release issues by 90%.
Below is the comprehensive workflow diagram that maps the data input, impact mapping, scenario planning, and sensitivity analysis processes that were central to the platform's functionality.
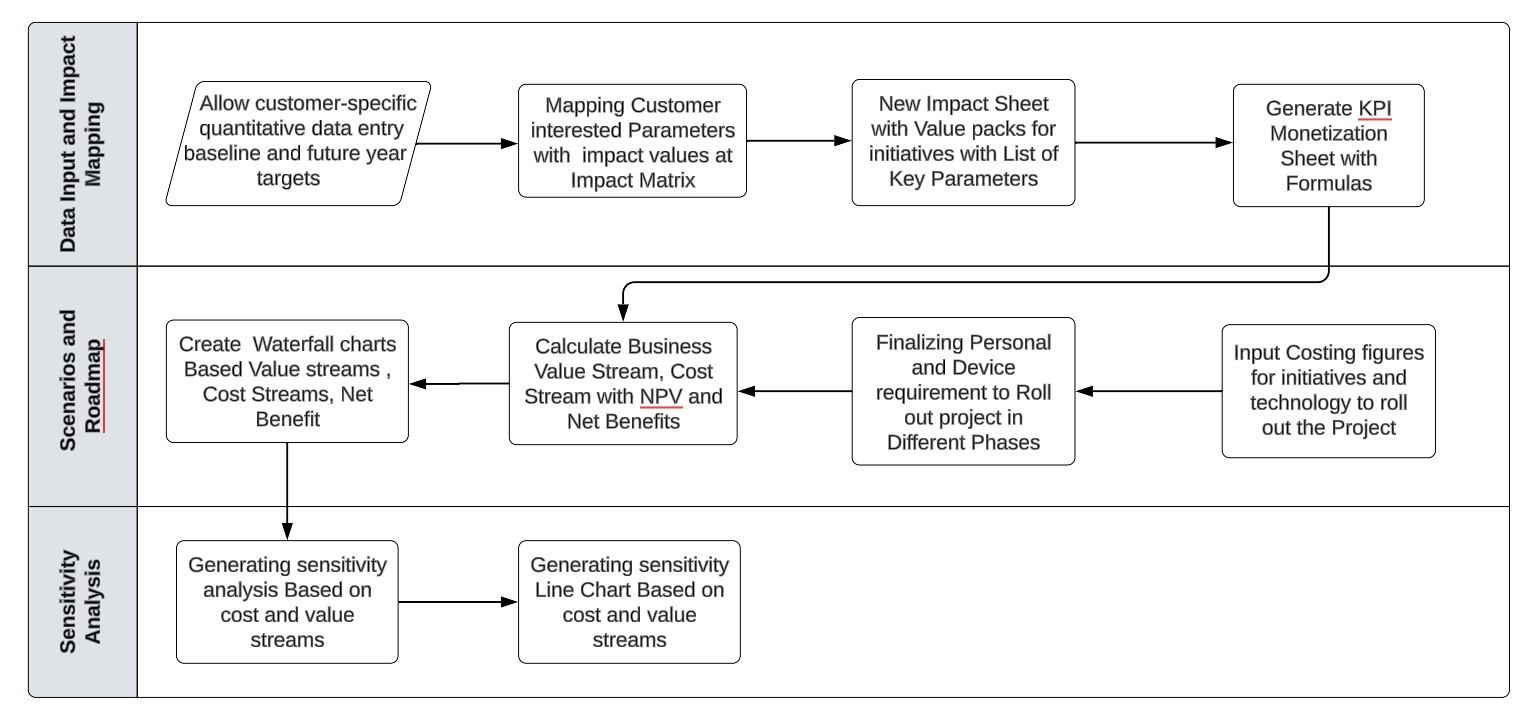
This workflow diagram illustrates the three-layer architecture: Data Input & Impact Mapping, Scenarios & Roadmap, and Sensitivity Analysis, showing how customer data flows through the system to generate actionable business insights.
Challenges Faced
Key obstacles overcome during project delivery
Challenge:
Key decision-makers were often unavailable due to their operational workloads.
Solution:
I mitigated this by sending concise, structured question summaries and video walkthroughs for asynchronous validation, ensuring alignment without delays.
Challenge:
Balancing desired business outcomes with technical constraints in the R&D environment.
Solution:
Partnered with developers to prioritize low-effort, high-impact features, maintaining both delivery speed and functionality.
Challenge:
Required validation of model outputs against client Excel simulations to ensure full accuracy and credibility.
Impact:
Extensive cross-validation was necessary to build client trust and ensure analytical integrity.
Quantified Results
Measurable improvements across all key performance indicators
| Metric | Before | After | Improvement |
|---|---|---|---|
| Reporting Time | 4-5 Hours | <1 Hour | 85% |
| Decision-Making Time | 3 Days | <1 Day | 70% |
| Reporting Accuracy | ~85% | ~99.5% | 17% |
| Post-Release Issues | High | Minimal | 90% |
| Team Engagement | Low | 15+ Active Users | Significant |
Explore More
This project showcases my ability to drive digital transformation in complex enterprise environments.